- Training
All Access Membership
Get access to our Contractor Academy that gives you all of our courses for a low monthly cost.
On-Demand Courses
Browse our course catalog to see what is available in the Contractor Academy all access membership.
- Resources
Blog
Tips and industry knowledge to help you grow your business.
Roadmap to Success
This program will take you through 8 specific areas of your company you must master to run a more profitable, less stressful business.
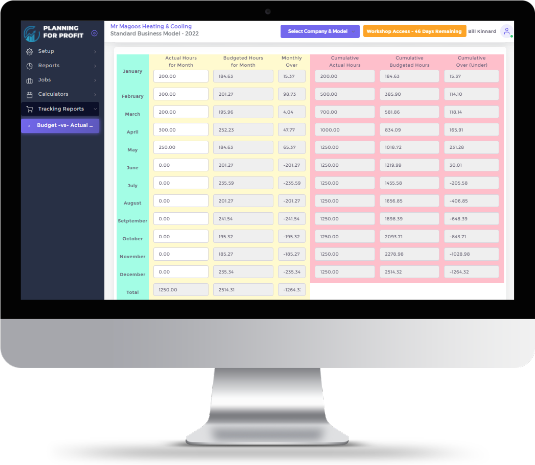
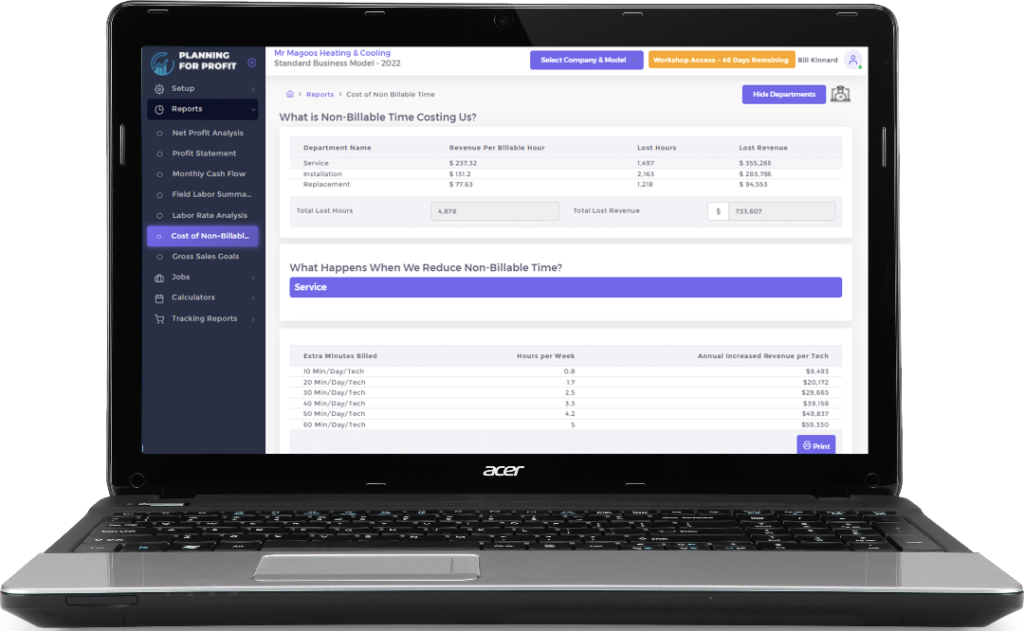
Planning For Profit Software
The most recognized company modeling software available.
Additional Products
Purchase additional one-off products to help your business growth.
- Contact Us
Menu